Weather Stations
Within Culteva it is possible to upload CSV1 weather data files. For example, the evaluation company Provar, which is the owner and developer of Culteva, uses TInyTags weather data loggers (Tinytag Plus 2 TGP-4500) for monitoring temperature and humidity in evaluation sites to record weather data and this data is then easily downloaded to Culteva. As in the case of weather data integration, any other third-party devices and technology for automated data collection can be accommodated on Culteva on a per project request basis.
CSV File - A comma-separated values file is a delimited text file that uses a comma to separate values. Each line of the file is a data record. Each record consists of one or more fields, separated by commas. The use of the comma as a field separator is the source of the name for this file format.
The Weather data collected, can be displayed in automated graphs and presented as different temperature models and used in the Culteva Report if needed. Any new models can be accommodated on a per project request basis.
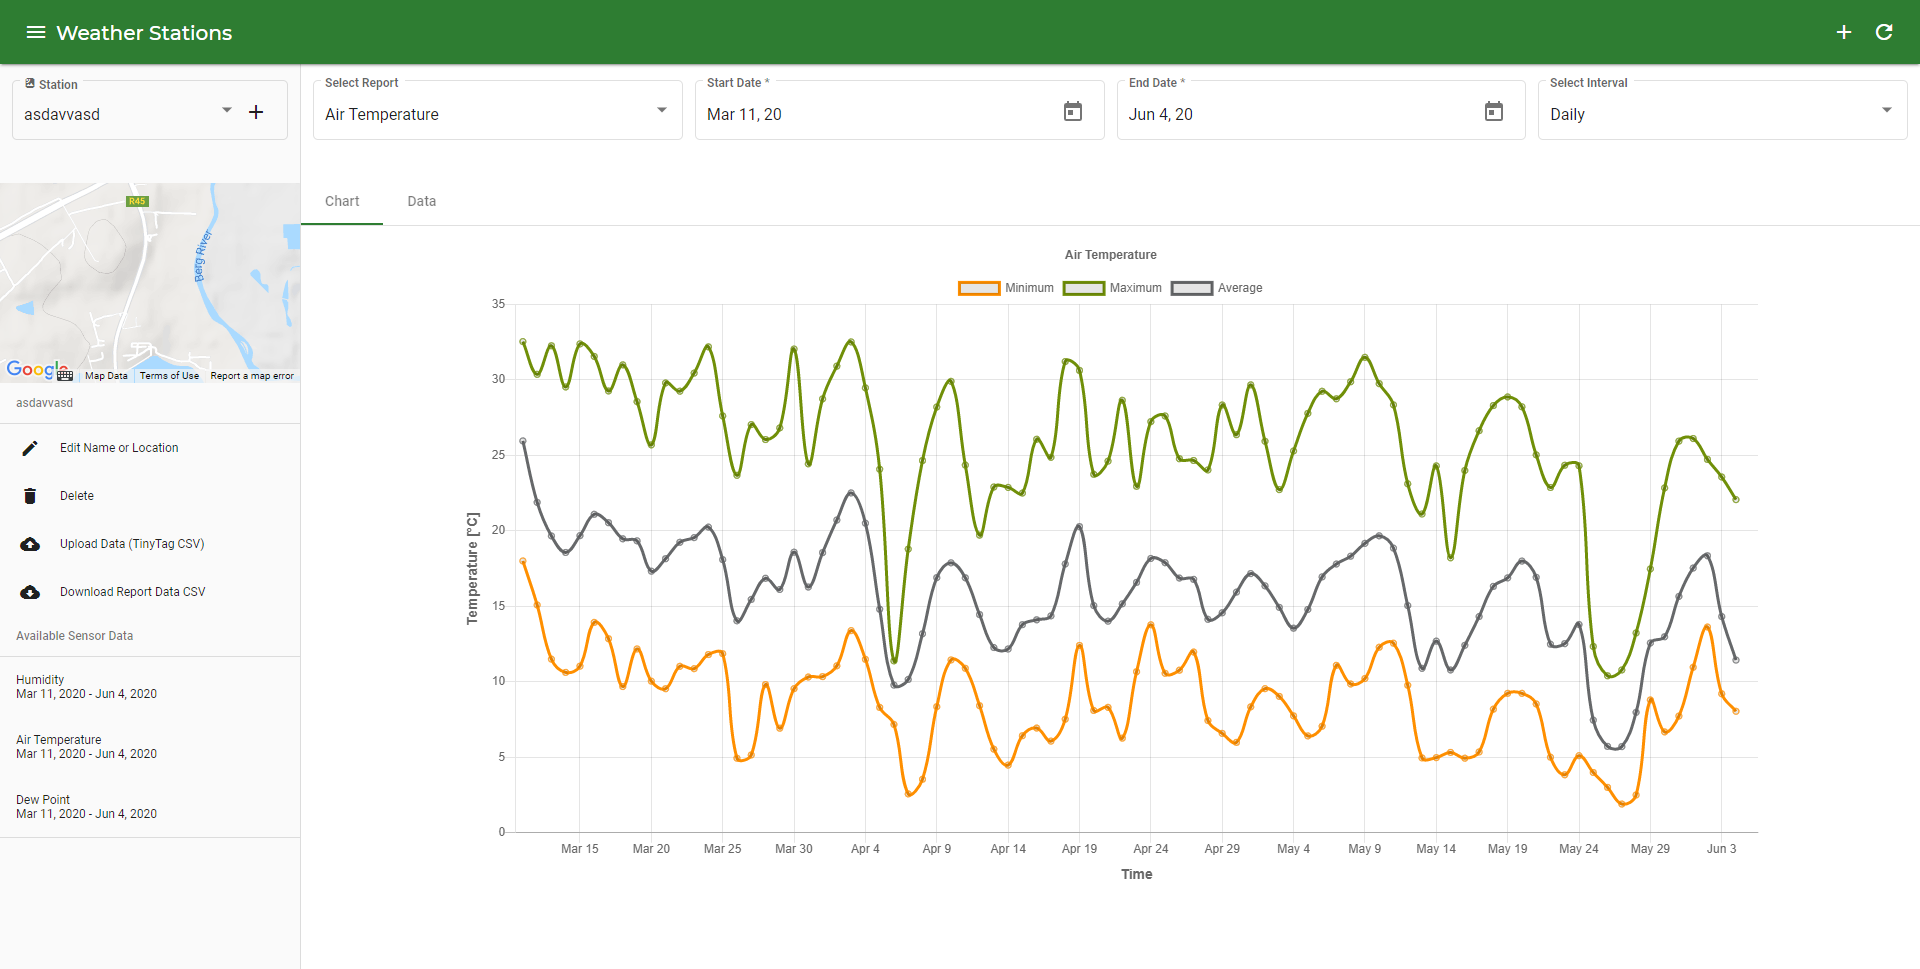
The Weather Station Index showing detail of a Weather Station
How to add a Station
To add a new Weather Station you can either:
- Click the plus button next to the Station dropdown at the top left of the screen
- Or click the plus button at the top right hand side of the screen
Once you have opened the form, you will be able to fill in the details of the Weather Station you would like to add.
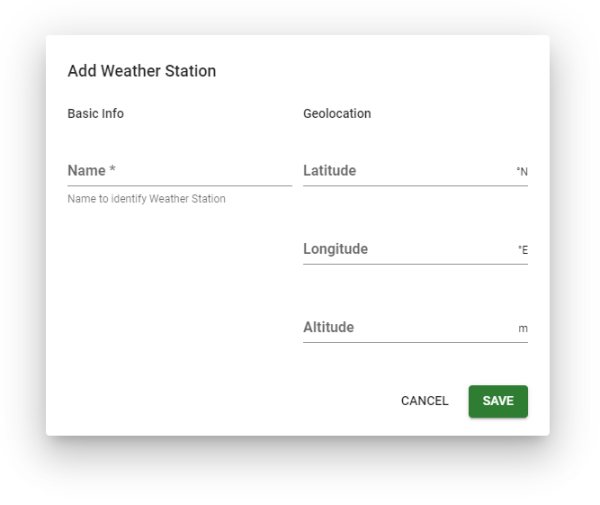
The Weather Station form with basic information fields
- Name: The identifier of the Weather Station
- Geolocation: The geographical location of the Weather station to appear on the map
When you have completed the form click the SAVE button.
You will now see that you have added a new weather station and you are now ready to upload weather data for this station.

The Station detail when there is no data uploaded yet
On the left are a few options on the sidebar:
- Edit Name of Location - Reopen the form to make changes to the Stations' details
- Delete - Remove the station and the data attached to it
- Upload Data - Upload data to the Station e.g. in Tinytag CSV format
- Download Report Data CSV - Download the data attached to the Station via email in CSV/Excel format
- Contact us - For other upload formats used in weather data collection devices, get in touch with our support team
Index
After you have registered your Weather Stations, you can start uploading Weather data.
To upload data to the Station, click the Upload Data button on the left Sidebar.
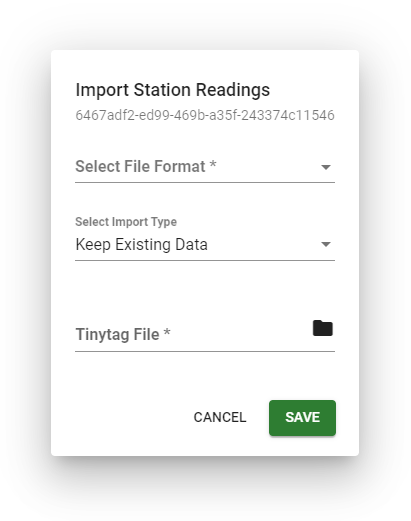
The data upload form for TinyTag data
The fields available are as follows:
- Select file format - This option will depend on the data that you want to upload, be it soil, humidity or air temperature
- Select Import Type - This will determine if the data uploaded will keep the existing data or replace all data. The Replace all data option will remove all current data within the Station and replace the data collected for the new data collection period
- Tinytag File - After you have downloaded the Tinytag data file, you can directly export it to an excel format which will then be ready to be uploaded. Select the file you wish to upload
If you have any problems uploading data please feel free to contact Culteva Support
You will now be able to view the data if the upload was successful.
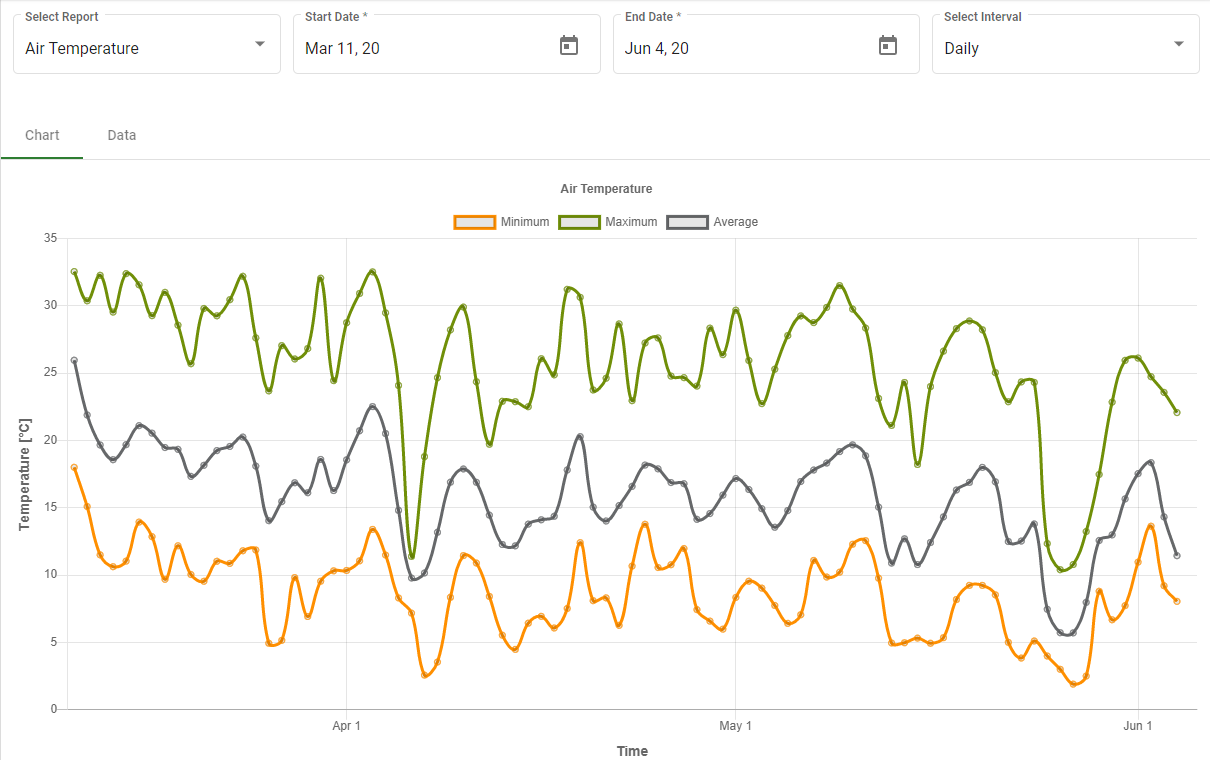
The detail view of a Weather Station after you have uploaded data
The data will be displayed within a graph with a few options.
Firstly you will be able to switch between graph view and the raw data at the top left of the graph.
The next option is a choice between dropdown options.
Select Report (Weather Models)
- Air Temperature
- Chill Units (Utah / Richardson and Infruitec* models)
- Dynamic Chilling Portions
- Growing Degree Days [choose between 10°C or 4.5°C as base temperatures]
- Growing Degree Hours [choose between 10°C or , 4.5°C as base temperatures]
- Cumulative Solar Radiation
- Relative Humidity
Start Date
You will have the option to select the start date as to which date to view the data from on the graph.
End Date
Select the end date at which to limit the data and the end of the graph.
(Note both Start and End date changes do not make permanent changes to the data).
Select Interval
Select the interval in which you would like to view the data on the graph, in hours, days or months.